
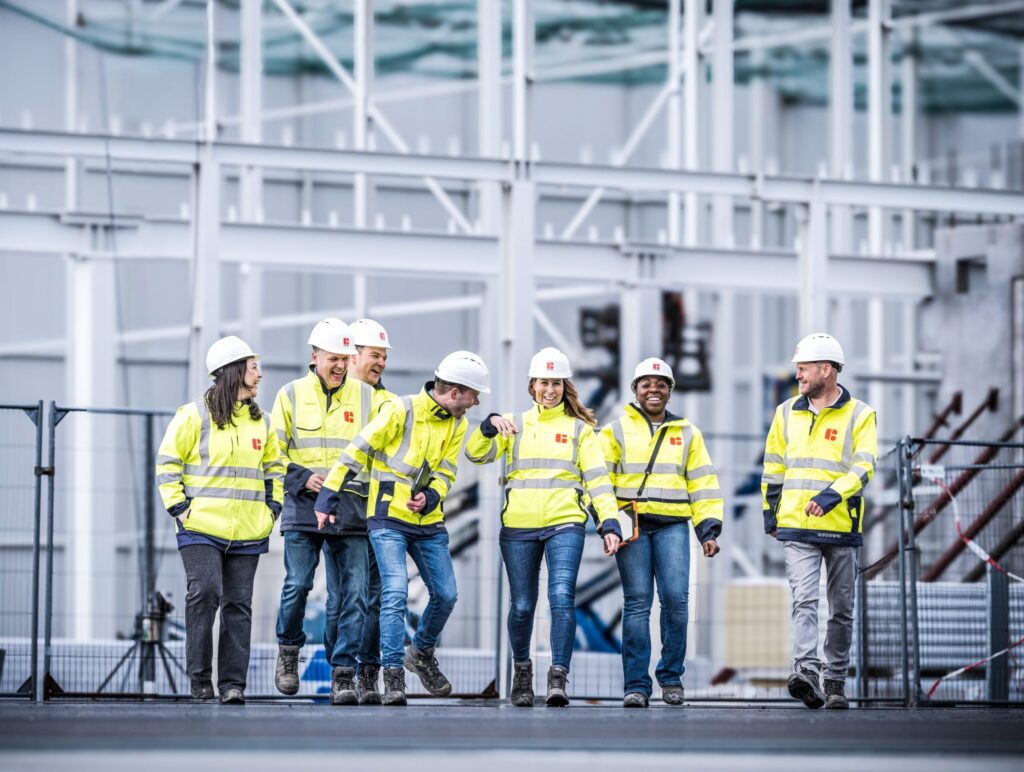
Diversity
Cordeel is a truly international company with 1,892 employees from over 40 different nationalities. We continue working to increase our diversity, through ensuring diversity of gender, age, origin, education and disabilities.
Employees by gender
Cordeel Group employs 1,892 individuals, including 1,620 men, 269 women, and 3 employees who prefer not to disclose their gender identity
Over the past few years, we have managed to attract more and more female colleagues. In our opinion this can be linked to the flexible work environment that Cordeel Group is providing, an improved employer branding as well as our compelling vision of becoming “the happiest company to work for/with”.
We employ 18 women at top management level, which represents 18.2%.
-
Male85.6%
-
Female14.2%
-
Prefer not to disclose0.2%
Employees by contract type & gender per country
*scope: complete Cordeel Group
S1-6, DP 50b, 51 & 52
| Category | Belgium | Netherlands | Bulgaria | Serbia | Hungary | Poland | Total |
|---|---|---|---|---|---|---|---|
| Headcount - Non-guaranteed hours female employees | 0 | 0 | 0 | 0 | 0 | 0 | 0 |
| Headcount - Non-guaranteed hours male employees | 0 | 0 | 0 | 0 | 0 | 0 | 0 |
| Headcount - Other non-guaranteed hours employees or who prefer not to specify the gender | 0 | 0 | 0 | 0 | 0 | 0 | 0 |
| Headcount - Permanent female employees | 202 | 23 | 21 | 7 | 2 | 6 | 261 |
| Headcount - Permanent male employees | 1341 | 128 | 91 | 20 | 11 | 3 | 1594 |
| Headcount - Other permanent employees or employees who prefer not to specify | 3 | 0 | 0 | 0 | 0 | 0 | 3 |
| Headcount - Temporary female employees | 5 | 3 | 0 | 0 | 0 | 0 | 8 |
| Headcount - Temporary male employees | 9 | 17 | 0 | 0 | 0 | 0 | 26 |
| Headcount - Other temporary employees or employees who prefer not to specify | 0 | 0 | 0 | 0 | 0 | 0 | 0 |
| Grand total | 1,560 | 11 | 112 | 7 | 13 | 9 | 1,892 |
Gender distribution at top management level
We define top management level as the CEO’s and one hierarchical level below, excluding board of directors.
*scope: complete Cordeel Group
S1-9, DP 66.a, AR 71
| Gender | Number | % |
|---|---|---|
| Top management male | 81 | 81.8 % |
| Top management female | 18 | 18.2 % |
| Top management who prefer not to specify | 0 | 0 % |
| Grand total | 99 | 100% |
Age
*scope: complete Cordeel Group, except of Technocon
S1-9-66b
| Age category | Number of employees | % of employees |
|---|---|---|
| < 30 years | 262 | 14.3% |
| 30 - 50 years | 908 | 49.5 % |
| > 50 years | 665 | 36.2 % |
Disabilities
*scope: Bulgaria, Hungary, Netherlands, Serbia, Sobeltec, Pivaco, C-bernard, C-EVH. The Belgian HR Service Center is not monitoring disabilities of employees.
S1-12, DP 80
| Seniority category (in years) | Number of employees |
|---|---|
| Number of female employees with disabilities | 0 |
| Number of male employees with disabilities | 6 |
Gender pay gap
S1-15, DP 97a
In 2024 we report on the unadjusted average pay gap for companies in the Netherlands, Bulgaria and Belgium with more than 1 employee (except of Sobeltec, Pivaco, Technocon, C-bernard)
The unadjusted average pay gap of these companies is 12.2%
In the calculation we sum all the average gross pay level of men and women and we calculate in absolute the gender pay gap (and not an average of the percentages like we did in the previous year).
In general, these differences are linked to the functions the female colleagues hold, e.g. there are more junior women holding administrative positions, compared with male project managers with high seniority.
In 2022, we implemented salary scales per function which will limit salaries diverging from the start.
Additionally, we implemented a clear policy on wage mark-ups, with the intention of making it unlikely that the salaries of a group will rise faster than the other.
With the new contracts being covered and wage mark-ups being unified we aim to decrease the salary pay gap eventually. Additionally, we can see that more (young) women are joining Cordeel Group in general, which is a great sign and which will also help closing the gender pay gap.
We will continue to dive deeper into this KPI, so that we will be able to report an adjusted average year, which paints a more realistic picture.
The gender pay gap is the difference in percentage between average gross hourly earnings of male paid employees and of female paid employees.
S1-15, DP 97a
Total remuneration ratio
S1-15, DP 97b
In 2024 we report on the annual total remuneration ratio for companies in the Netherlands, Bulgaria and Belgium with more than 1 employee (except of Sobeltec, Pivaco, Technocon, C-bernard)
The total remuneration ratio of these companies is 1.94.
The ratio of the annual total compensation ratio is calculated as the difference of the compensation of the highest paid individual to the median annual total compensation for all employees.