GHG emissions
At Cordeel Group, we are dedicated to transforming the future by focusing on innovation to create smart, energy-efficient, and low-carbon solutions. Reducing our carbon footprint is a crucial aspect of this mission. In 2023, we reduced our scope 1 & 2 emissions with -31,8%.

What do we report on?
Our GHG emission reporting covers scope 1 & 2 emissions as well as business travel (scope 3) all companies of the Cordeel Group in Belgium, the Netherlands and Bulgaria. Exceptions are C-EVH, Technocon, C-guard and Off Site Belgium.
This organisational boundary is larger than what we report on in the framework of the CO₂ Performance Ladder, which is currently focused on the operations of Cordeel zetel Temse as well as the companies located on our site “De Zaat” in Temse, Cordeel zetel Hoeselt and Cordeel Nederland.
The emission factors we use to calculate our carbon footprint are the well-to-wheel emission factors that we use for the CO₂ Performance Ladder in Belgium and the Netherlands as well.
The calculation of scope 1 & 2 is linked to actual consumption of the companies and based on invoices or other proof. We strive for a calculation that is exact as possible and assume that we achieved an accuracy of 95%.
The number of companies included in the boundary of the scope 1 & 2 calculation is increasing every year. Where possible, we try to calculate the emissions of newly-added companies also to previous years to show a realistic trend.
In 2023, we calculated for the first time an important part of our scope 3 emissions: the purchased goods.
No carbon credits have been purchased. We are currently focusing completely on reducing our footprint without using a carbon removal or storage approach.
What are scope 1 emissions?
Scope 1 CO₂ emissions are direct greenhouse gas emissions that come from sources owned or controlled by a company, such as from our own vehicles, construction equipment or heating and cooling.
What are scope 2 emissions?
Scope 2 emissions are indirect greenhouse gas emissions that come from the generation of purchased electricity, steam, or heat consumed by a particular company or organisation. These emissions are generated by another entity, such as a utility company, but are a result of the energy consumed by the reporting company.
What are scope 3 emissions?

CO₂ Performance Ladder
The CO₂ Performance Ladder is a sustainability tool and certification scheme that empowers companies to reduce CO₂ emissions by implementing practical measures, fostering innovation and sharing knowledge. It is actively used as a criterion for awarding public contracts in the construction industry.
The idea behind the tool is to encourage the entire sector to establish a continuous management system for reducing CO₂ emissions, rather than working solely on project-based measures. As a result, the ladder delivers energy and cost savings for the company.
In 2021, the companies located at our site in Temse got certified at level 3 and we have been reporting on our CO₂ emissions and the progress since then. In 2023, Cordeel Nederland and Cordeel zetel Hoeselt were added to the organisational boundary.
We aspire to achieve level 5, the highest level, during our upcoming re-certification in the summer of 2024.

Energy performance in 2023*
*Companies that we’re reporting on: all companies in Belgium, the Netherlands; Hungary and Bulgaria, except of Technocon, C-EVH, Follaets Painting & NLT Pivaco
| Renewable or not renewable? | Type | Sum of kWh |
|---|---|---|
| Non-renewable | Purchased electricity | 8,313,885.25 |
| Total not renewable energy | 8,313,885.25 | |
| Renewable | Purchased electricity | 2,497,700.55 |
| Self-generated electricity | 1,781,785.00 | |
| Total renewable energy | 4,279,485.55 | |
| Total electricity consumption | 12,593,370.8 | |
Energy intensity
*Companies that we’re reporting on: all companies in Belgium, the Netherlands and Bulgaria, except of Technocon, C-EVH, Follaets Painting & NLT Pivaco
| Consumption of electricity in MWh | Turnover in mio € | MWh per mio € turnover |
|---|---|---|
| 12,593.37 | 866.73 | 14.53 |
Total GHG emissions 2023
*Companies that we’re reporting on: all companies in Belgium, the Netherlands, Hungary and Bulgaria, except of Technocon, C-EVH, Off Site Belgium, ForGrowth, Flywel & NLT Pivaco
| Scope | GHG emissions in tCO2 | % of grand total | Revenue in mio € of companies in boundary | Carbon intensity |
|---|---|---|---|---|
| 1 | 9,502.5 | 3.9% | 876.13 | 10.85 |
| 2 (market-based) | 1,725.1 | 0.7% | 876.13 | 2.00 |
| 3 | 231,043.9 | 95.4% | 770.43 | 299.89 |
| Grand total | 242,298.6 |
GHG emissions per scope
GHG emissions per scope
-
Scope 19502tons
-
Scope 21725.1tons
-
Scope 3231043.9tons
GHG emissions by energy type
scope 1 & 2
| Category | Scope | GHG emissions in tCO2 | % of total |
|---|---|---|---|
| Mobile combustion | 1 | 8,930 | 79.3% |
| Purchased & self-generated electricity (market-based) | 2 | 1,494 | 13.3% |
| Stationary combustion (heating) | 1 | 544 | 4.8% |
| Purchased heat | 2 | 86 | 0.8% |
| Fugitive emissions from aircleaks | 1 | 27 | 0.2% |
| Process emissions | 1 | 1 | 0.0% |
GHG emissions by division
scope 1 & 2
| Division | GHG emissions in tCO2 | % of total |
|---|---|---|
| C-construct | 6,091 | 54.1% |
| C-production | 1,065 | 9.5% |
| C-tech | 2,998 | 26.6% |
| C-energy | 42 | 0.4% |
| C-living (Vita groep) | 687 | 6.1% |
| C-innovation | 332 | 3.0% |
GHG emission reduction over the years
Our efforts in reducing our carbon emissions in scope 1 & 2 over the years is shown here.
In 2023 we achieved an absolute reduction of -895.3 tons CO2 and an intensity-based reduction of -31.8%, compared with our base year 2021.
The number of companies included in the boundary of the scope 1 & 2 calculation is increasing every year. Where possible, we try to calculate the emissions of newly-added companies also to previous years to show a realistic trend.
| Year | Scope | CO2-emissions in tons | Absolute reduction to base year 2021 (in tons) | Revenue in mio € of companies in boundary | % of total revenue | Intensity: CO2 emissions per mio € revenue | Intensity reduction to base year 2021 |
|---|---|---|---|---|---|---|---|
| 2021 | 1 & 2 | 12,150 | - | 645.35 | 85.2% | 18.83 | - |
| 1 | 10,131 | - | 15.7 | - | |||
| 2 | 2,019 | - | 3.13 | - | |||
| 2022 | 1 & 2 | 11,734 | -416 | 823.01 | 87.6% | 14.3 | -24.3% |
| 1 | 10,071 | -60 | 12.2 | -22.1% | |||
| 2 | 1,663 | -356 | 2.02 | -35.4% | |||
| 2023 | 1 & 2 | 11,254.7 | -895.3 | 876.13 | 93.4% | 12.85 | -31.8% |
| 1 | 9502.5 | -628.5 | 10.85 | -30.9% | |||
| 2 | 1,752.1 | -266.9 | 2.00 | -36.1% | |||
| 3 | 231,043.9 | - | 770.43 | 83% | 299.89 | - |
GHG emission reduction targets
| Reporting year | Measure | Status |
|---|---|---|
| 2023 | 100% green electricity for all locations | Starting from 01/2024 90% of Belgian locations |
| Roll-out mobile energy boxes on construction sites | ongoing | |
| Report on scope 1 & 2 of complete Cordeel group | All companies in BE, NL, HUN & BG. Except of Technocon, C-EVH, Off Site Belgium, ForGrowth, Flywel & NLT Pivaco --> 93.4% of revenue covered | |
| Report on the three most material scope 3 emissions | Purchased goods category of companies that are representing 83% of revenue | |
| 2024 | Receive certification for CO2-prestatieladder level 5 | |
| EPD of most common precast concrete mix | ||
| 2025 | Report on scope 1-3 of complete Cordeel group | |
| 90% of passenger cars are electric | ||
| 2026 | 100% of passenger cars are electric | |
| 2027 | CO2-neutrality scope 1 & 2 with reduction of at least 75% (compared with base year 2021) | 2023: - 31.8% intensity based, -895.3% absolute |
| 2030 | Precast elements: 50% reduction in CO₂-eq emissions compared to 1990 emissions in the Flemish Region (Vlaams Betonakkoord) |
Scope 3
We analyzed the various categories of scope 3 emissions and concluded that purchased goods is the main driver of our emissions.
We used a spend analysis of companies that represent 83% of the Cordeel Group’s turnover and focused on the Top 80% suppliers, based on the accumulated spending.
In order to calculate the emissions, we used the spend-based-methodology: each supplier is based to a NACE code and category. The spending in Euros is linked to an emission factor from the providers ADEME or Exiobase.
We are aware that this method is not the most exact, but it represents a great starting point to dive deeper into our scope 3 emissions in the next months.
The companies this calculation is based on are: Cordeel zetel Temse, Cordeel zetel Hoeselt, Cordeel Nederland, Imtech, C-wood, C-metal, C-concrete.
| Category | GHG emission in tCO2 | % of total scope 3 |
|---|---|---|
| Purchased goods - Construction | 81,833.3 | 35.4% |
| Purchased goods - Fabricated metal products | 67,757.3 | 29.3% |
| Purchased goods - Machinery and equipment installation | 45,339.7 | 19.6% |
| Purchased goods - other categories | 36,085.6 | 15.6% |
| Business Travel | 28 | 0.01% |
| Grand total | 231,043.9 |
Emission-free construction sites
Fossil fuels consumed on our construction site account for 18.7% of our total CO₂ emissions. When zooming into our C-construct division, fossil fuels even account for 30% of their CO2 emissions and are therefore an important driver of our scope 1 & 2 emissions.
To achieve our ambition of emission-free construction sites, we focus on their electrification. To achieve this, we apply the decarbonisation levers:
Grid connection
Grid connection
Where available, we use a grid connection with as much power and as early as possible.
Measuring consumption
Measuring consumption of electricity
With our C-scan sensors, we monitor electricity consumption of the main consumers on construction sites.
The sensors offer a transparent view of the electricity needed for tower cranes, dewatering of construction pits, and on-site offices, depending on the time of the year and phase of the works.
This provides us with the insights we need to take the right reduction measures.
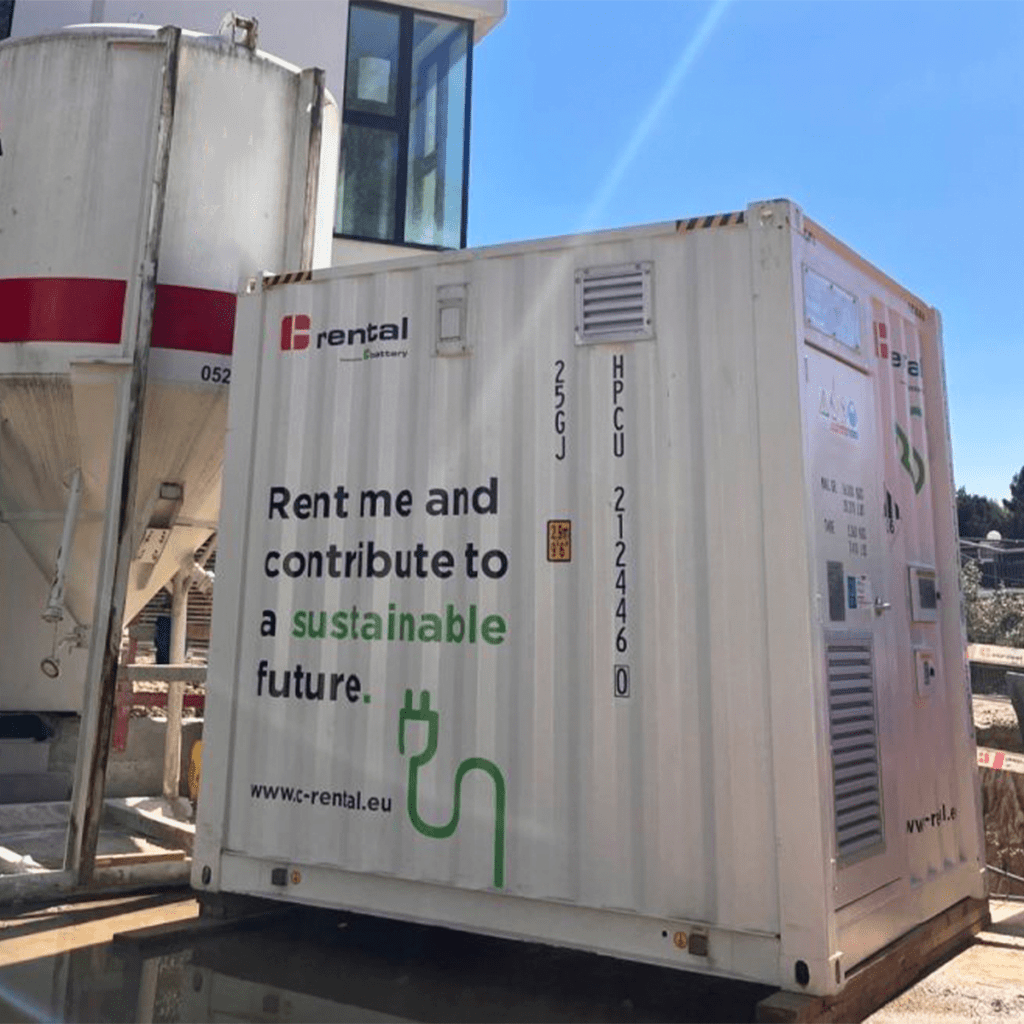
Mobile energy boxes
Mobile energy boxes on construction sites
Since construction sites tend to have a limited or even no grid connection, this missing capacity is supplemented by diesel-powered generators. These have a negative impact on several environmental aspects such as noise, dust, nitrogen, ineffective fuel use, and high CO₂ emissions resulting from the use of fuel.
We noticed that we often use diesel generators with a capacity higher than required. The main reason is that tower cranes have power peaks for a very short period of time for which the capacity is dimensioned.
Our thorough measuring helped resize our mobile battery containers that we started to roll-out in 2023. C-battery is engineering and assembling these battery containers, based on lithium-ion technology and available in two versions, both built in 10ft containers: 100 kWh & 215 kWh.
Eventually, these mobile batteries will make generators obsolete and have a major positive impact on the environment: less noise, less smell, less CO₂ and nitrogen emission
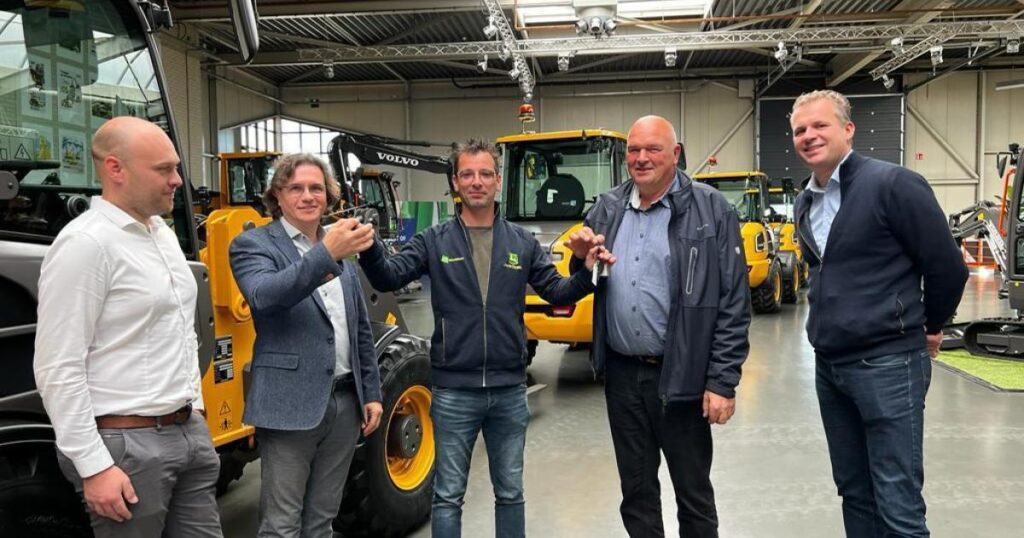
Electric construction equipment
Electric construction equipment
Apart from using mobile energy boxes to replace generators, we also invest in electric machinery.
C-rental purchased five Volvo L25 Electric Wheel Loaders, which have the same power as a diesel-powered wheel loader but produce no emissions.
Furthermore, C-rental has integrated 100 electric scissor lifts and telescopic boom lifts into its fleet.
Use of biofuels
Use of biofuels
HVO100 is a synthetic biofuel under the EN15940 standard, consisting 100% of waste vegetable oils treated with hydrogen (HVO = ‘Hydrated Vegetable Oil’). It emits 89% less CO₂ over the entire life cycle (‘well-to-wheel’) compared to regular diesel.
Cordeel Nederland uses HVO 100 for every construction site.
We consider HVO 100 to be a transition fuel towards full electrification of construction sites.
Transport by water
Transport by water
The strategic location of Cordeel Group headquarters alongside the Scheldt river provides us with the opportunity to use the river for our transportation requirements. This is not only efficient but also lowers our scope 3 emissions and helps us avoid the congestion of Belgian and Dutch highways.
We also rely on water transportation to deliver raw materials for our concrete plant and the soil required to construct our energy hill in Temse.
Most of the prefab elements used to build the Amazon warehouse on the Blue Gate site in Antwerp were transported via water and picked up at our dry dock.
In Rotterdam, we’re currently building “De Boompjes” which is located right on the Maas river with the iconic Erasmus bridge in plain sight. By using water transportation, we were able to reduce 350 instances of traffic along congested roads in Rotterdam.
This approach is the ideal solution for inner-city buildings on the water. Not only did we significantly reduce truck traffic for residents and passers-by, but it also allows for the efficient use of the vessel to expand the limited construction site.
Greening the fleet
Fossil fuel plays a significant role in driving our CO₂ emissions. The fuel for our fleet accounts for 56.9% of our total CO₂ emission, a mere 6,405 tons. This makes the fossil fuel for the fleet the major driver of our CO2 emissions.
Reducing these emissions is our main lever to decarbonise our scope 1 & 2 GHG emissions.
Charging poles
We’re providing charging poles at all of our locations and as well at the homes of our employees that drive electric vehicles.
Our HQ in Temse has more than 60 charging poles available.
Powerstation, our charging pole supplier, is constantly expanding its range of charging poles available.
Their latest generation of charging stations will allow users to charge their vehicles without the need for a charge card or app thanks to the automatic authentication technology. Powerstation has plans to further develop a V2G (Vehicle-To-Grid) capability at a later stage, enabling vehicles to inject power back into the grid and serve as a driving battery for a variety of applications
Fully electric car policy
In 2022, we have adapted our car policy to exclusively use 100% electric passenger cars to reduce our dependence on fossil fuels and lower our CO₂ emissions. Since then, no hybrid or fossil fuel powered passenger cars were ordered.
However, one of the main challenges we face is the speed of delivery of the vehicles and the availability of suitable electric vans with a sufficient range, especially for the technicians at Imtech.
Therefore we ordered ten ID. Buzz by Volkswagen to test for which activities they would be the most suitable. We expect that these vans will help us decarbonising our fleet further.
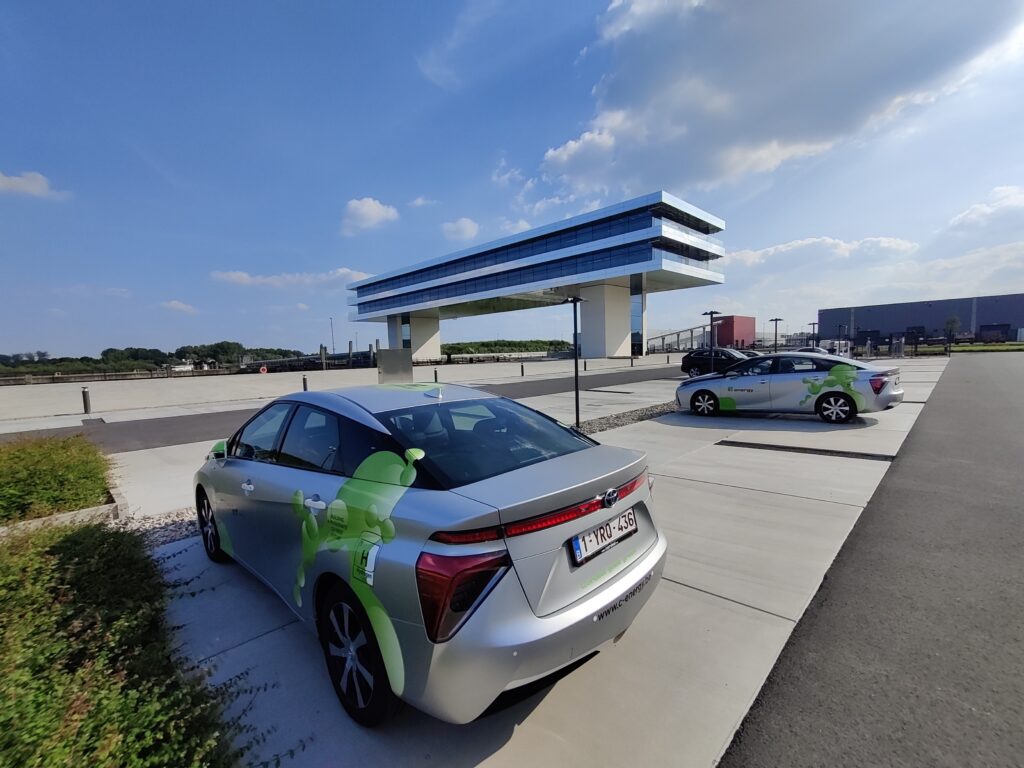
Hydrogen cars
We believe in hydrogen’s potential as a sustainable energy carrier. We consider it a possible alternative for our bigger vehicles and for longer distances where battery technology may not be adequate.
Currently, we are running a pilot project using hydrogen-powered vehicles. To this end, C-energy purchased four Toyota Mirai hydrogen cars that are available as pool cars for employees who require transportation for site visits, customer appointments, etc.
In our Temse headquarters, we built our own hydrogen gas station. In 2024 our elektrolyser will start operating so that we produce the hydrogen ourselves.