
GHG emissions
At Cordeel Group, we are dedicated to transforming the future by focusing on innovation to create smart, energy-efficient, and low-carbon solutions. Reducing our carbon footprint is a crucial aspect of this mission.
As a construction company, our carbon footprint is dominated by what we build with, not how we operate.
Scope 1 and 2 emissions are significant and we are actively reducing them. In 2025, we realised an absolute reduction of our scope 1 & 2 emissions with -19.5 % compared to the previous year.
But the real challenge is in Scope 3: the emissions embedded in the materials we buy and use on our projects. Embodied carbon is where construction companies like us have the biggest impact, and it is where our strategy is most focused.
To understand our footprint properly, we have moved from a spend-based methodology where we applied generic emission factors to supplier spending to an activity-based approach.
Reducing our carbon footprint requires action across two fronts: embodied carbon — the carbon locked into the materials we use — and operational carbon, which we address through the energy transition.
What are scope 1 emissions?
Scope 1 CO₂ emissions are direct greenhouse gas emissions that come from sources owned or controlled by a company, such as from our own vehicles, construction equipment or heating and cooling.
What are scope 2 emissions?
Scope 2 emissions are indirect greenhouse gas emissions that come from the generation of purchased electricity, steam, or heat consumed by a particular company or organisation. These emissions are generated by another entity, such as a utility company, but are a result of the energy consumed by the reporting company.
What are scope 3 emissions?

Transition plan for climate change mitigation
We have not yet adopted a formal transition plan for climate change mitigation. We plan to adopt one by the end of 2026, enabling us to report on it in our sustainability report covering financial year 2026. Our board follows our decarbonisation efforts closely and is actively involved in setting up the climate transition plan.
We have established greenhouse gas emission reduction targets covering Scope 1 and Scope 2 emissions. A Scope 3 reduction target for the medium and long term is currently under development and is expected to be defined by the end of 2026.
While a formal plan is not yet in place, we are already actively working on reducing our emissions through multiple strategic levers, and we have made significant progress. Our Scope 1 and Scope 2 emissions dropped by 50.4% in absolute terms compared to our base year 2021.
A key driver of this reduction has been the electrification of our passenger car fleet, which started in 2022. We have also invested significantly in the electrification of our construction sites by replacing traditional diesel generators with mobile battery boxes. We have acquired 50 mobile battery boxes to support this transition.
Approximately six years ago, we initiated a broader strategic shift in our business model towards the energy transition and low-carbon construction. New entities and joint ventures were established focusing solely on the energy transition — C-energy, C-battery and C-ground — as well as innovative low-carbon construction materials through C-biotech, C-fire and Ariomat.
In the reporting year, we realised 14.8% of our total group revenue with renovation projects with a high focus on applying reuse materials. This revenue more than doubled compared to the previous year, and we plan to continue growing this activity with several such projects already in our order book.
We use Life Cycle Assessments (LCAs) to determine and reduce the embodied carbon of our projects. Additionally, we develop LCAs and Environmental Product Declarations (EPDs) for some of our key self-produced products, including precast concrete elements and hemp-based construction materials.
At C-concrete, we have been working for more than five years on the decarbonisation of the concrete mix used in our precast elements. In the reporting year, we decreased the carbon intensity of our precast concrete by 33% compared to our base year 2021, and we plan to reach a 50% reduction by 2030.
Regarding potential locked-in greenhouse gas emissions, two of our three VITA swimming pools, built five to eight years ago, are heated by natural gas. Several other buildings within the group are also heated by natural gas, though these emissions represent only a fraction of our total greenhouse gas emissions. Additionally, an oven at our precast company C-concrete is heated by natural gas. We will assess in the future what is technically and economically feasible to replace these gas-based systems.
In the reporting year, we had no capital expenditure related to coal, oil or gas economic activities.
We mainly work on two big levers: embodied carbon and the energy transition which are explained more detailed later in this report.
CSRD:
Climate-related risks and scenario analysis
We have performed an initial identification of climate-related risks across our operations, though we have not yet conducted a formal climate-related risk and scenario analysis. We plan to complete this process by FY 2027 at the latest.
Physical risks:
Flooding at construction sites, extreme heat affecting workers, and storm damage are relevant across our construction operations in Belgium, the Netherlands, Bulgaria, and Serbia. Belgium represents our main revenue base, with the Netherlands contributing 25% of revenue in the reporting year.
Less frequent but more intense rainfall could impact hemp harvests at C-biotech, which currently plants and harvests in Belgium. However, hemp demonstrates natural resilience as a crop: water is only necessary during early growth stages, after which very little is needed. This characteristic is an advantage as we plan further geographic expansion of our hemp cultivation activities.
Transition risks:
Stricter building energy regulations, carbon pricing, and shifts in demand toward sustainable buildings are relevant across all our construction markets, particularly in Belgium and the Netherlands where regulatory frameworks are evolving rapidly.
Given the early stage of our climate-related risk assessment, we have not yet applied a formal methodology for assessing the exposure and sensitivity of our assets and business activities over the short, medium, and long term, nor have we conducted climate-related scenario analysis. These steps are planned for completion by FY 2027.

CSRD:
CO₂ Performance Ladder
The CO₂ Performance Ladder is a management tool and certification scheme that empowers companies to reduce CO₂ emissions by implementing practical measures, fostering innovation and sharing knowledge. It is actively used as a criterion for awarding public contracts in the construction industry.
The idea behind the tool is to encourage the entire sector to establish a continuous management system for reducing CO₂ emissions, rather than working solely on project-based measures. As a result, the ladder delivers energy and cost savings for the company.
In 2021, the companies located at our site in Temse got certified at level 3 and we have been reporting on our CO₂ emissions and the progress since then. In 2023, Cordeel Nederland and Cordeel zetel Hoeselt were added to the organisational boundary.
We have the ambition to reach step 2 of the adapted methodology “Handbook 4.0” by our upcoming audit in summer 2026. Step 2 includes scope 3 emission targets.
While we certify the business with the highest revenue with ISO 14001 and the CO2-performanceladder, we don’t yet have a dedicated, standalone climate change mitigation policy.

CSRD:
Energy mix and consumption
| Name | Unit |
|---|---|
| Fuel consumption from coal and coal products (MWh) | 0.00 |
| Fuel consumption from crude oil and petroleum products (MWh) | 14,808.21 |
| Fuel consumption from natural gas (MWh) | 2,204.09 |
| Fuel consumption from other fossil sources (MWh) | 0.00 |
| Consumption of purchased or acquired electricity, heat, steam, and cooling from fossil sources (MWh) | 2,714.05 |
| Total fossil energy consumption (MWh) | 19,726.36 |
| Consumption from nuclear sources (MWh) | 0.00 |
| Share of consumption from nuclear sources in total energy consumption (%) | 0.00 |
| Fuel consumption for renewable sources (e.g., biomass, biogas, hydrogen) (MWh) | 0.00 |
| Consumption of purchased/acquired electricity, heat, steam, and cooling from renewable sources (MWh) | 7,625.96 |
| The consumption of self-generated non-fuel renewable energy/ renewable energy production (MWh) | 1,852.91 |
| Total renewable energy consumption (MWh) | 9,478.87 |
| Total energy consumption (MWh) | 29,555.23 |
| Share of fossil sources in total energy consumption (%) | 66.75 |
| Share of renewable sources in total energy consumption (%) | 32.07 |
| Total energy consumption from activities in high climate impact sectors (MWh) | 29,555.23 |
| Energy intensity from activities in high climate impact sectors (MWh/Mil € net revenue) | 33.16 |
CSRD:
GHG emissions per scope 2025
GHG emissions per scope
-
Scope 15024.28tons
-
Scope 2556.76tons
-
Scope 3210918.05tons
CSRD:
Gross GHG emissions by scope and category
The number of companies included in the boundary of the scope 1 & 2 calculation is increasing every year. Where possible, we try to calculate the emissions of newly-added companies also to previous years to show a realistic trend.
In 2025 we added C-Serbia for the first time, without a previous period as comparison.
The companies on which we report scope 1 & 2 emissions represent > 99,5% of our consolidated revenue.
| Scope | Consolidation approach | Category/sub-category | 2021 (tCO2eq) — Base Year | 2024* (tCO2eq) — Comparative | 2025 (tCO2eq) | Compared to previous year (%/ total tCO2eq) | Compared to base year (%/ total tCO2eq) |
|---|---|---|---|---|---|---|---|
| Scope 1 | Equity share | Gross Scope 1 GHG emissions | 9,344.83 | 6,392.63 | 5,024.28 | -21.4% / -1,368.35 | -46.23% / -4,320.55 |
| Scope 1 | Equity share | % Scope 1 emissions from regulated emission trading schemes | 0.00 | 0.00 | 0.00 | - | - |
| Scope 2 | Equity share | Gross market-based Scope 2 GHG emissions | 1902.96 | 510.25 | 556.56 | +9.1% / + 46.31 | -70.76% / -1,346.4 |
| Scope 3 | Equity share | Total gross indirect Scope 3 GHG emissions | not monitored | 261,996.44 | 210,918.03 | -19.5% / -51,078.41 | - |
| Scope 3 | Equity share | 1. Purchased goods and services | not monitored | 259,728.14 | 208,317.92 | -19.8% | - |
| Scope 3 | Equity share | 3. Fuel and energy-related activities (not in Scope 1 or 2) | 91.45 | ||||
| Scope 3 | Equity share | 4. Upstream transportation and distribution | 667.37 | 2,508.66 | |||
| Scope 3 | Equity share | 5. Waste generated in operations | 758.50 | ||||
| Scope 3 | Equity share | 8. Upstream leased assets | 842.43 | ||||
| Total | Equity share | Total GHG emissions (market-based) | 11,247.79 | 268,899.32 | 216,498.87 | -19.5% |
CSRD:
We analyzed the various categories of scope 3 emissions and concluded that purchased goods and services (PGS) is the main driver of our emissions.
In 2025 we analysed the PGS emissions of companies that represent 92,5% of the Cordeel Group’s revenue.
To our Top 100 suppliers we reached out via our partner ClimateCamp to receive activity-based data.
These suppliers represent our most material impacts (e.g. concrete, steel, facades, timber, transport.) which can deliver concrete amounts. The share of activity-based data of our total scope 3 emissions is around 30%.
The rest of the PGS emissions were calculated using the spend-based methodology.
To avoid double-accounting between the various Cordeel group companies, we report only on the external suppliers in 2025.
*2024 is purely calculated following the spend-based methodology for Top 80% suppliers, based on accumulated spending. Therefore it’s not a fair comparison. Boundary of included companies: Cordeel zetel Temse, Cordeel zetel Hoeselt, Cordeel Nederland, Imtech, C-wood, C-metal, C-concrete, Cordeel Amsterdam

Gross GHG emissions by scope and country
| Country | Scope 1 (tCO2eq) | Scope 2 Market-based (tCO2eq) | Scope 3 (tCO2eq) | Total Market-based (tCO2eq) |
|---|---|---|---|---|
| Belgium | 3,974.90 | 329,05 | 138,823.5 | 143,127.49 |
| Netherlands | 598.41 | 60.51 | 66,709.53 | 67,368.44 |
| Bulgaria | 295.61 | 92.81 | 5,385.05 | 5,773.44 |
| Serbia | 155.36 | 74.39 | not monitored | 229.75 |
| Hungary | not monitored | not monitored | not monitored | not monitored |
| Poland | not monitored | not monitored | not monitored | not monitored |
| Group Total | 5,024.28 | 556.76 | 210,918.05 | 216,499.12 |
CSRD:
Emission-free construction sites
To achieve our ambition of emission-free construction sites, we focus on their electrification. To achieve this, we apply various decarbonisation levers
Grid connection
Grid connection
Where available, we use a grid connection with as much power and as early as possible.
Measuring consumption
Measuring consumption of electricity
With our C-scan sensors, we monitor electricity consumption of the main consumers on construction sites.
The sensors offer a transparent view of the electricity needed for tower cranes, dewatering of construction pits, and on-site offices, depending on the time of the year and phase of the works.
This provides us with the insights we need to take the right reduction measures.
Mobile energy boxes
Mobile energy boxes on construction sites
Since construction sites tend to have a limited or even no grid connection, this missing capacity is supplemented by diesel-powered generators. These have a negative impact on several environmental aspects such as noise, dust, nitrogen, ineffective fuel use, and high CO₂ emissions resulting from the use of fuel.
We noticed that we often use diesel generators with a capacity higher than required. The main reason is that tower cranes have power peaks for a very short period of time for which the capacity is dimensioned.
Our thorough measuring helped resize our mobile battery containers that we started to roll-out in 2023. C-battery is engineering and assembling these battery containers, based on lithium-ion technology and available in two versions, both built in 10ft containers: 100 kWh & 215 kWh.
Eventually, these mobile batteries will make generators obsolete and have a major positive impact on the environment: less noise, less smell, less CO₂ and nitrogen emission
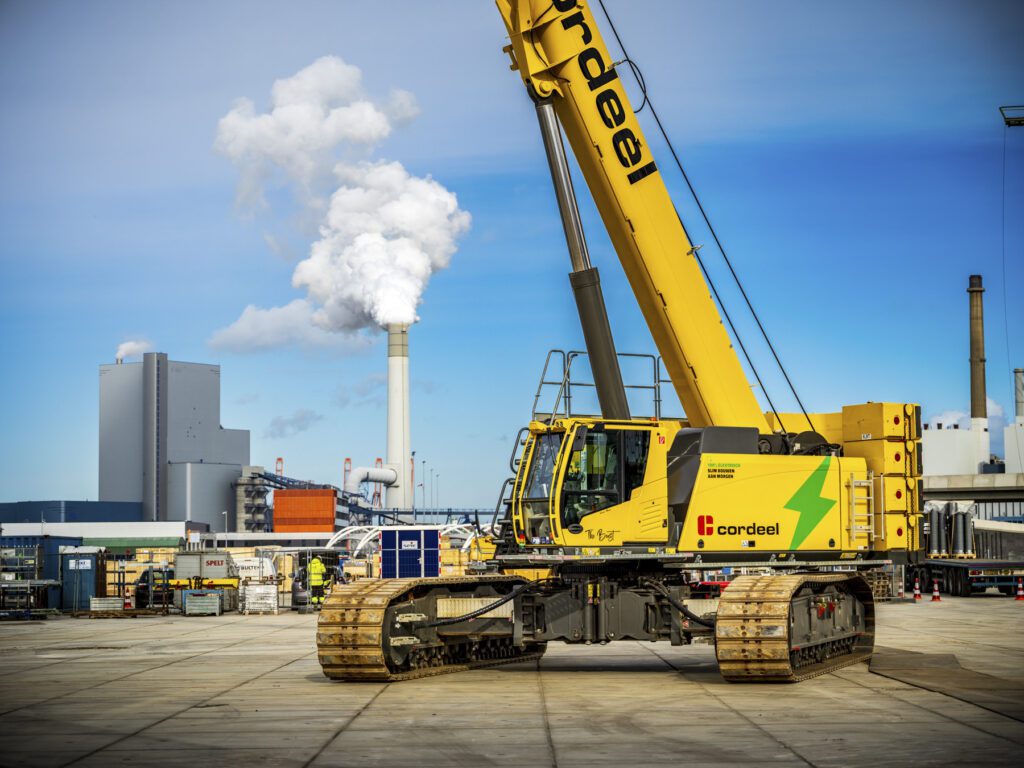
Electric construction equipment
Electric construction equipment
Apart from using mobile energy boxes to replace generators, we also invest in electric machinery.
C-rental purchased five Volvo L25 Electric Wheel Loaders, which have the same power as a diesel-powered wheel loader but produce no emissions.
Furthermore, C-rental has integrated 100 electric scissor lifts and telescopic boom lifts into its fleet.
Use of biofuels
Use of biofuels
HVO100 is a synthetic biofuel under the EN15940 standard, consisting 100% of waste vegetable oils treated with hydrogen (HVO = ‘Hydrated Vegetable Oil’). It emits 89% less CO₂ over the entire life cycle (‘well-to-wheel’) compared to regular diesel.
Cordeel Nederland uses HVO 100 for every construction site.
We consider HVO 100 to be a transition fuel towards full electrification of construction sites.
Transport by water
Transport by water
The strategic location of Cordeel Group headquarters alongside the Scheldt river provides us with the opportunity to use the river for our transportation requirements. This is not only efficient but also lowers our scope 3 emissions and helps us avoid the congestion of Belgian and Dutch highways.
We also rely on water transportation to deliver raw materials for our concrete plant and the soil required to construct our energy hill in Temse.
Most of the prefab elements used to build the Amazon warehouse on the Blue Gate site in Antwerp were transported via water and picked up at our dry dock.
In Rotterdam, we’re currently building “De Boompjes” which is located right on the Maas river with the iconic Erasmus bridge in plain sight. By using water transportation, we were able to reduce 350 instances of traffic along congested roads in Rotterdam.
This approach is the ideal solution for inner-city buildings on the water. Not only did we significantly reduce truck traffic for residents and passers-by, but it also allows for the efficient use of the vessel to expand the limited construction site.
CSRD:

Greening the fleet
Fossil fuel plays a significant role in driving our CO₂ emissions. The fuel for our fleet accounts for more than two thirds of our total CO₂ emission. This makes the fossil fuel for the fleet the major driver of our CO2 emissions.
Reducing these emissions is our main lever to decarbonise our scope 1 & 2 GHG emissions.
Charging poles
We’re providing charging poles at all of our locations and as well at the homes of our employees that drive electric vehicles.
Our HQ in Temse has more than 75 charging poles available.
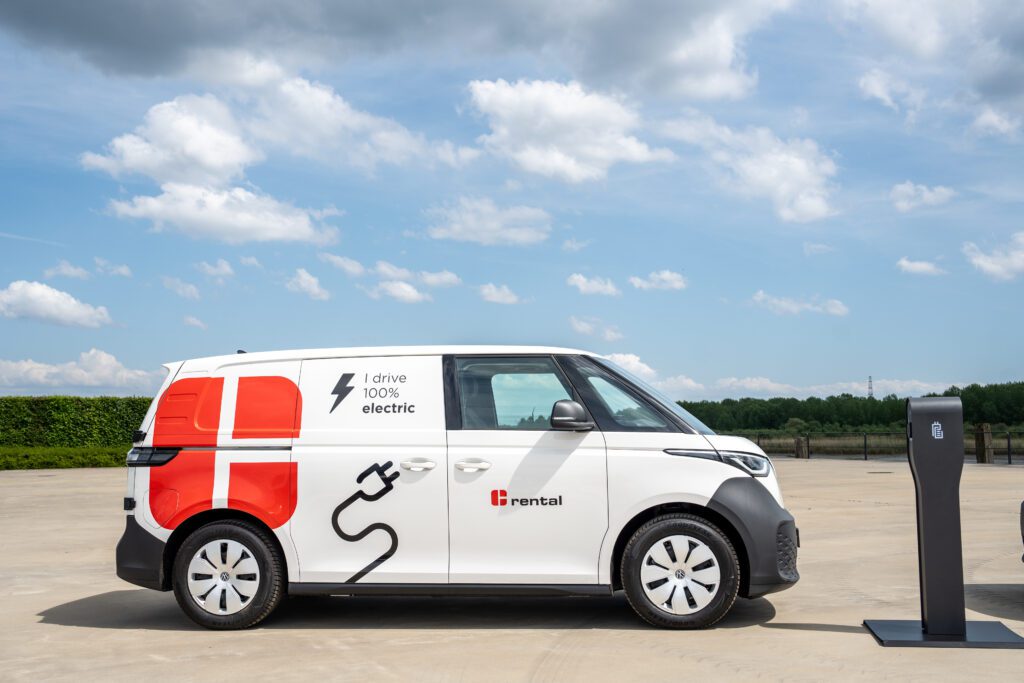
Fully electric car policy
In 2022, we have adapted our car policy to exclusively use 100% electric passenger cars to reduce our dependence on fossil fuels and lower our CO₂ emissions. Since then, no hybrid or fossil fuel powered passenger cars were ordered.
However, one of the main challenges we face is the speed of delivery of the vehicles and the availability of suitable electric vans with a sufficient range, especially for the technicians at Imtech.
Therefore we ordered ten ID. Buzz by Volkswagen to test for which activities they would be the most suitable. We expect that these vans will help us decarbonising our fleet further and we will additionally explore the electrification of the smallest category of light commercial vehicles.
CSRD:
GHG removals and GHG mitigation projects financed through carbon credits
We have not implemented any GHG removal or storage projects within our own operations or across our upstream and downstream value chain.
We have not purchased or cancelled any carbon credits in the reporting year, nor have we made any public claims of GHG neutrality. Our strategy focuses on reducing our carbon footprint through direct emission reductions.
Our subsidiary Earth+ supports producers of bio-based construction materials in certifying their carbon credits through the Rainbow Registry and brokers those credits to organisations building credible carbon portfolios.
Rather than merely offsetting, this initiative emphasises the important co-benefit of initiating and supporting the transition of the construction sector from oil-based to bio-based materials.
This approach was recognised by Deloitte and awarded a project in their Beyond the Value Chain Mitigation programme.
In the reporting year, these credits are sold to third parties but are not purchased or used by Cordeel Group itself.
CSRD:
Internal carbon pricing
We do not currently apply an internal carbon pricing scheme. As such, carbon pricing is not used in our decision-making processes, including investment decisions, transfer pricing, or scenario analysis, and no average carbon price per metric tonne of GHG emissions has been established.
CSRD:
FAQ
In 2025, our total GHG footprint across all three scopes was 216,499 tonnes of CO₂-equivalent. Of that, Scope 1 (direct emissions from our vehicles, equipment, and heating) was 5,024 tonnes; Scope 2 (purchased electricity) was 557 tonnes; and Scope 3 (the emissions embedded in the materials we buy and use) was 210,918 tonnes. Scope 3 is by far the largest category, and purchased goods and services (mostly concrete, steel, facades, and timber account) for almost all of it.
Compared to our 2021 base year, we have cut our absolute Scope 1 and 2 emissions by 50.4%. We are already more than halfway to our 2030 target of a 72% reduction. In 2025 alone, Scope 1 and 2 fell by 19.1% compared to the previous year.
Because that is where our real impact is. Our Scope 1 and 2 emissions are significant and falling fast. But Scope 3, the carbon locked into the materials we buy and use on projects, is around 40 times larger. Reducing embodied carbon through green concrete, bio-based materials, and renovation over demolition is where construction companies like us make the most difference.
In 2025 we did not use carbon offsetting and have made no public claim of carbon neutrality. Our strategy is built on direct emission reductions. We have cut Scope 1 and 2 emissions by 50.4% in absolute terms since our 2021 base year, and our Scope 3 work focuses on reducing the embodied carbon of what we buy and build with. Our subsidiary Earth+ helps producers of bio-based materials certify and broker carbon credits to third parties, but Cordeel Group itself does not purchase them. We think the more credible path is to show the numbers falling year on year.
Our total energy consumption in 2025 was 29,555 MWh. Of that, 32% came from renewable sources, including purchased green electricity and our own solar generation. Of all purchased and self-generated electricity, 74.2% was renewable. In Belgium and the Netherlands it’s even 90.2%. The remaining fossil-based energy is primarily petroleum products used in our vehicle fleet and construction equipment, and natural gas for heating. Increasing the renewable share especially through fleet electrification and site decarbonisation is the main lever we are pulling.
In Belgium, 85% of our passenger cars are now electric. Our target is 100% in both Belgium and the Netherlands by 2027. The electrification programme started in 2022, and since then no hybrid or fossil-fuel-powered passenger cars have been ordered. One remaining challenge is the delivery speed and range of suitable electric vans, particularly for Imtech technicians. We have ordered ten Volkswagen ID. Buzz vans and 15 small Peugeot EV-vans to test their suitability and will continue expanding into the lightest commercial vehicle category.
HVO100 is a synthetic biofuel made entirely from waste vegetable oils. It emits 89% less CO₂ over its full life cycle compared to regular diesel. Cordeel Nederland uses it across all its construction sites. We are clear that it is a transition fuel, not a permanent answer: the end goal is full electrification. But for equipment and vehicles that cannot yet run on electricity, HVO100 is how we reduce emissions while that transition completes.